
Pathway enrichment analysis
Pathway analysis is a powerful tool for understanding the biology underlying the data contained in large lists of differentially-expressed genes, metabolites, and proteins resulting from modern high-throughput profiling technologies. The central idea of this approach is to group these long lists of individual features into smaller sets of related biological features (genes and metabolites), usually based on biological processes or cellular components in which genes, proteins, and metabolites are known to be involved.
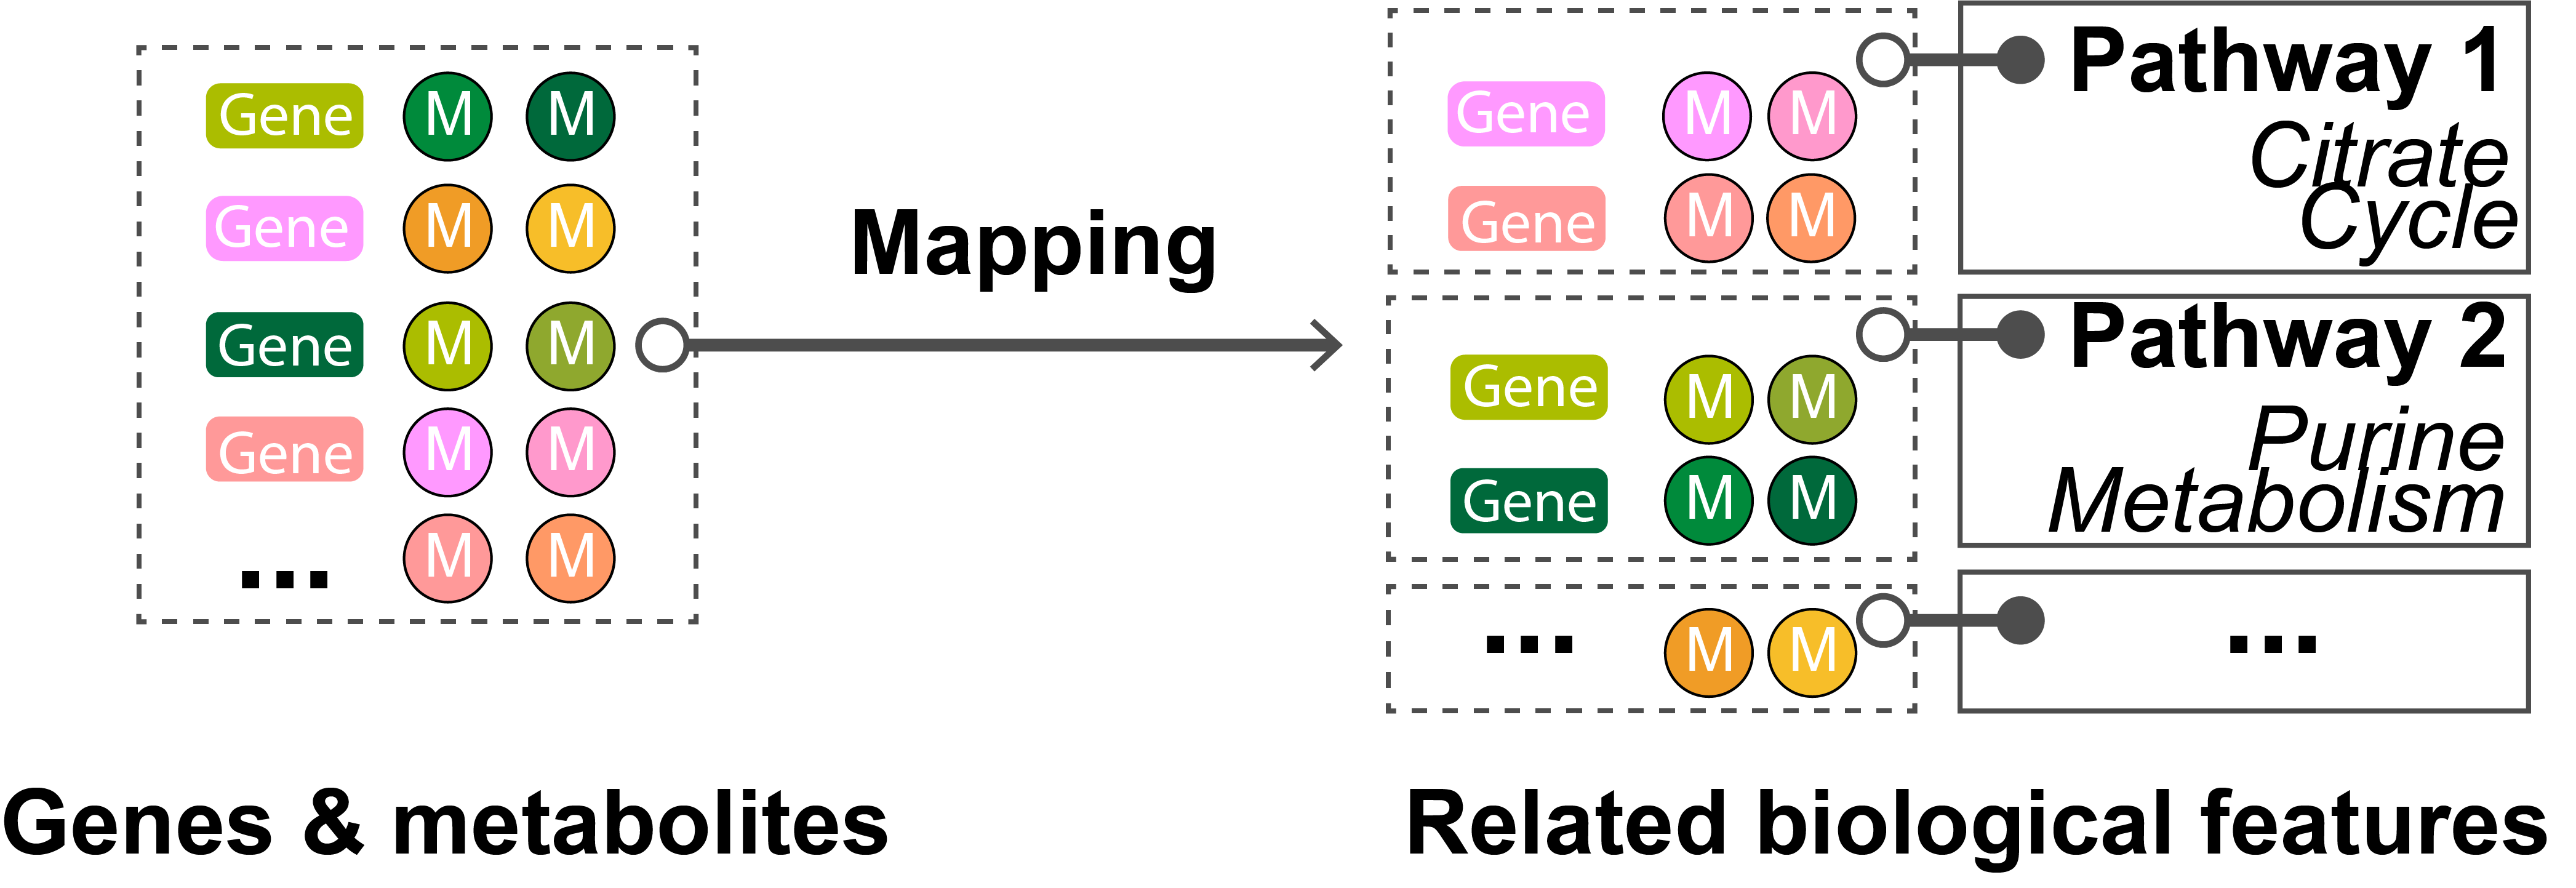
Figure 1.Pathway analysis gains mechanistic insight into a long list of genes and/or metabolites by grouping them into a smaller set of related biological features based on pathways.
One popular method for pathway analysis is pathway enrichment analysis , which is the approach adopted by the current version of PaintOmics 4. Figure 1 depicts the process followed to determine the set of significantly enriched pathways for the input data. First, the tool identifies the subset of genes, proteins, and metabolites that participate in a particular KEGG pathway for the input. Then, it evaluates the fraction of those biological features which overlaps with the set of features that the researcher considered significant, usually features showing significant changes in expression or concentration (e.g. the differentially-expressed genes). In the final step, the tool computes the significance of the overlap using the Fisher exact test. The p-value obtained can be interpreted as a measurement of the confidence that this overlap is due to chance (null hypothesis). The smaller the p-value, the more likely that the association between the features of interest and the pathway is not random, i.e. an overrepresentation of the significant biological features of that pathway may exist. As a general rule, a p-value of 0.05 is accepted as the threshold indicating a statistically significant association.
From this analysis the application ranks the pathways for each omics data type and sorts them from higher to lower statistical significance values. However, extracting meaning from multiple significance values can be complicated, especially when individually evaluating very different omics data types. Therefore, PaintOmics 4 incorporates an additional step in the process in order to obtain a joint significance value which indicates its relevance in the context of the biological system for each pathway. Hence, it applies the Fisher combined probability test, a statistical method which allows the results from several independent tests for similar null hypotheses to be combined. This method combines the p-values for each test into one test statistic (X) using the formula:
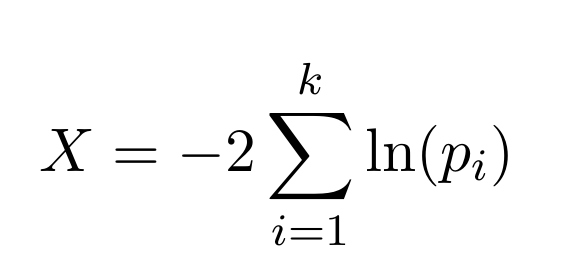
where p_i is the p-value for the i^{th} hypothesis test, k is the number of tests being combined and with X following a chi^2 distribution with 2k degrees of freedom, from which a p-value for the global hypothesis can be easily obtained.
Figure 2 shows an example of the visual representation of the ranking as a table. Note that the upper positions in the table correspond to the most relevant pathways, based on the combined p-value. Each row in the table represents a Pathway. The first column displays the name of the pathway, while the second and third columns indicate the total number of genes and metabolites found in the pathway. A colour label close to the pathway name identifies the main classification for the pathway, using the same colour code as that used in the "Pathway classification" section. The last column provides some useful links to external sources, such as KEGG or PubMed. The remaining columns indicate the significance value for each omics data type for each pathway, and a colour scale is used to highlight the level of enrichment for each one. When the mouse is moved over each cell the application displays the contingency table used for obtaining the significance value.
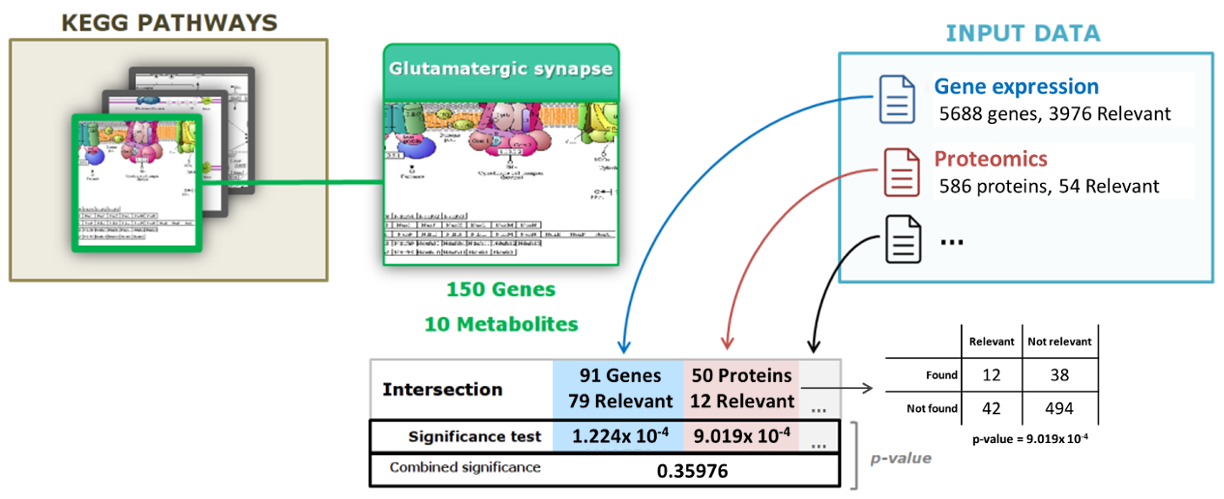
Figure 2. Significance evaluation for the Glutamatergic synapse KEGG pathway. The Glutamatergic synapse pathway contains a total of 150 genes and 10 metabolites that are known to participate in the biological processes. First, PaintOmics 4 finds the intersection between the features in the pathway and the features at each input data type. Next, the tool evaluates the fraction of relevant features that fall into the intersection. PaintOmics 4 uses these values to calculate a significance value for each omics data type. Lastly, a combined p-value is calculated using the Fisher combined probability test.
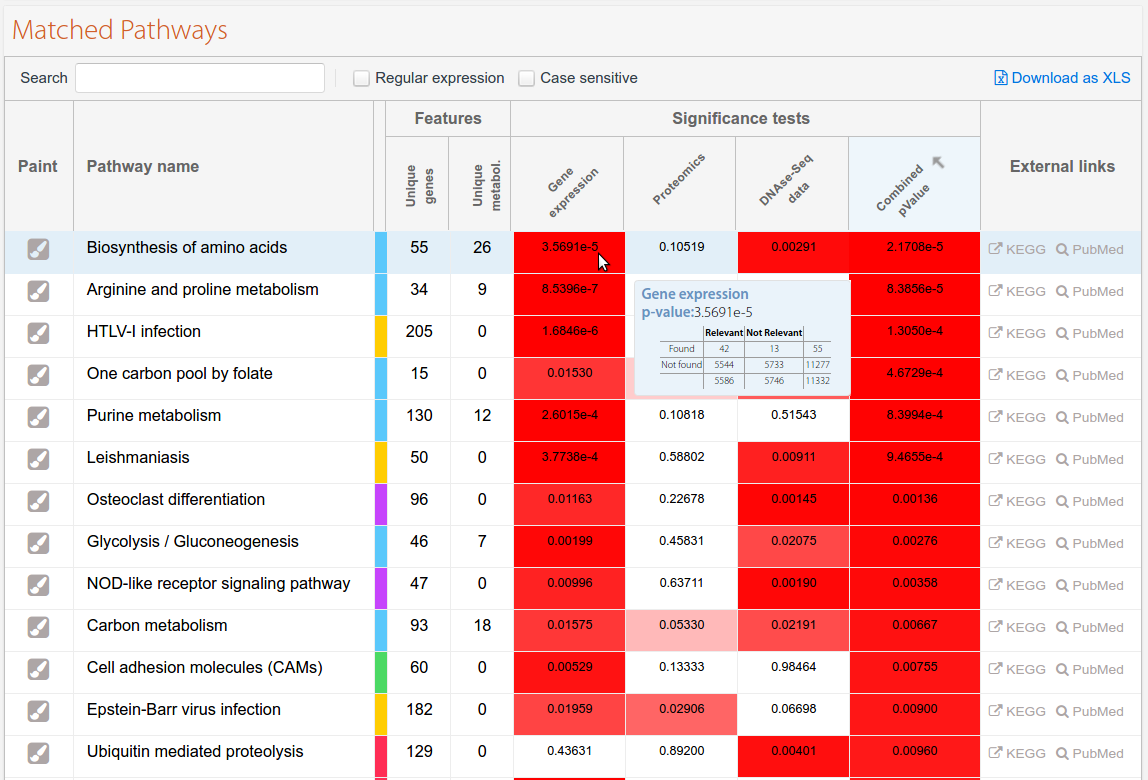
Figure 3. Pathways found for an experiment combining data from Gene Expression, Proteomics, and DNase-seq.