
Regulatroy omics analysis
Introduction
PaintOmics 3 provided the Regulatory Omics option designed to upload data on features such as microRNA-seq, acting as regulators of gene expression. PaintOmics 4 extends this functionality to accept any type of trans-acting element operating on genes, transcripts or proteins and includes filtering functions to extract meaningful regulatory relationships. In addition to microRNA-seq, transcription factors (TF) and splicing factors (SF), detected by RNA-seq, RNA-binding proteins identified by CLIP-seq, etc., can be analysed with this option. The Regulatory Omics option takes a trans-regulatory-feature data matrix with expression or activity values for regulators in the conditions of the study. The regulator-gene/protein mapping file is provided by the user, together with an optional list of significant deferentially expressed regulators. PaintOmics 4 filtering options include thresholds for positive or negative correlation to select the expected regulatory relationships. Applying these criteria, regulatory features (regulators) will be mapped to their targeted features and their corresponding pathways. A pathway enrichment score is calculated either based on the number of regulators mapping to each pathway or on the number of regulated genes present in the pathway. Enriched pathways for the Regulatory Omics modality represent biological processes that are significantly impacted by that regulatory layer (Figure 1).
Figure 1: The pipeline of Regulatory Omics analysis in PaintOmics 4
Input data, visualisation and parameters
Regulators expression and relevant files
Table 1 A shows the example of regulator expression files. The first column must contain the identifier of the regulators. The remaining columns contain the quantification values for each sample in the experiment, preferably on a logarithmic scale. Table 1B shows an example of a relevant features file for regulators: a unique column containing the identifiers or names for all significant features in the experiment.
Table 1: Example input for a regulators expression and relevant file (A) contains the regulators name (first column) followed by the quantification values for 3 different time-points, in logarithmic scale. Differentially expressed regulators are provided as a list (B).
Association and relevant associaiton file
Table 2 shows the example of the association file. The first column contains the identifier of the regulators, and the second column contains the feature name of the targeted features (gene name/metabolite name). This information is usually extracted from popular databases such as miRbase for miRNAs. See above the accepted format for the file.
Table 2: Example for association file The first column is associated features, and the second column is the regulator.
The relevant association file is a subset of the association file that could be directly uploaded by the user or automatically selected using correlation (the correlation between targeted features and regulators) in PaintOmics 4 (Figure 2B).
Figure 2: the relevant file upload panel (A) and relevant association file upload panel (B)
Regulatory omics visualisation
Figure 3A and 3B show the visualisation of the regulatory omics inside the pathway. The feature with a yellow star symbol indicates a relevant association between the feature and its regulators, and the feature with a red star symbol indicates that its regulators are significant.
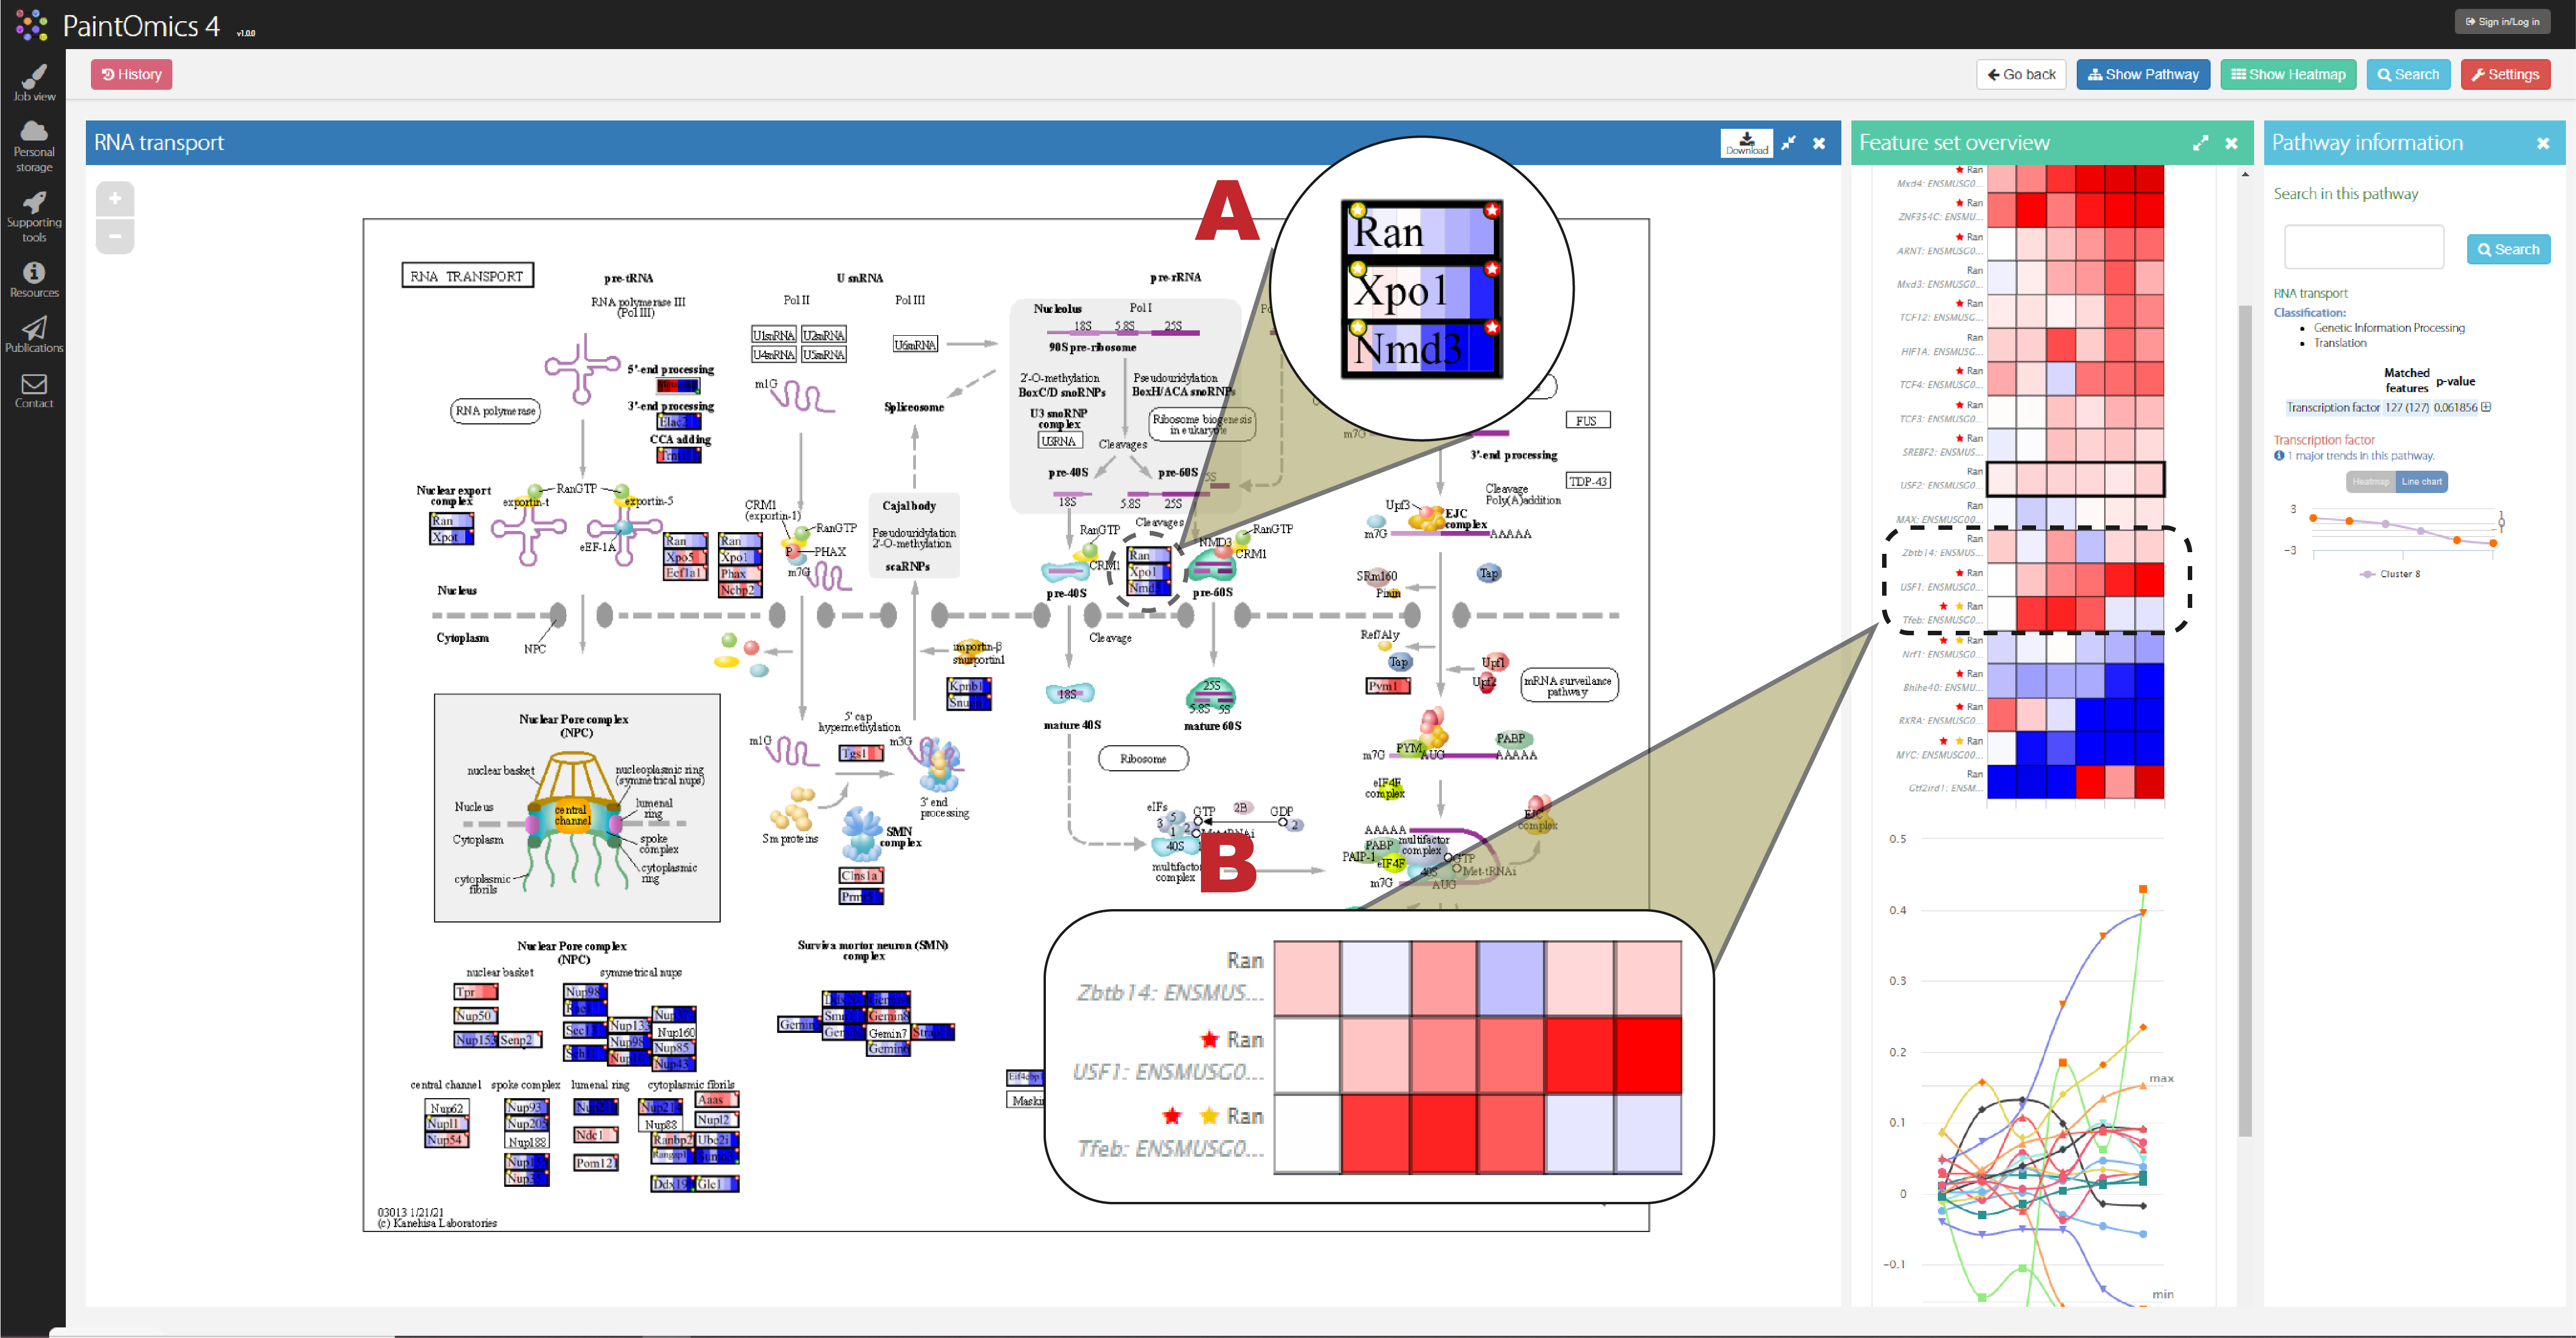
Figure 3: visualisation of the regulatory omics in the main panel (A) and auxiliary panel shows the expression of regulators of the feature (B)
Parameters
Omic Name: The Omic Mame parameter allows the user to define the name of its regulators or select from PaintOmics 4 build-in drop-down menu. If the omic name is Transcription factor, the transcription factor will map to the PaintOmics databases to find its gene symbol.
Enrichment type: The Enrichment type parameter defines how PaintOmics 4 must do the Fisher contingency table: counting genes, features (i.e., microRNA, proteins...), or associations (combination of genes & features).
Score method: The score method parameter defines how PaintOmics 4 calculate correlations between targeted features and regulators (only available when the relevant association file is not provided). As an example in miRNA, usually, a single miRNA has multiple potential target genes, but a certain miRNA is regulating not all targets at a certain moment. Consequently, we need to discriminate the real targets for a miRNA.Suppose Gene expression (GE) data is available. In that case, we calculate the correlation between each miRNA and each target gene and filter out all those miRNAs that have a lower correlation value than a given threshold. If no GE is available, we filter based on the fold-change for the expression of the miRNAs.Default: 'Kendall correlation' if GE is available. 'Fold Change' in other cases.