Metagenes
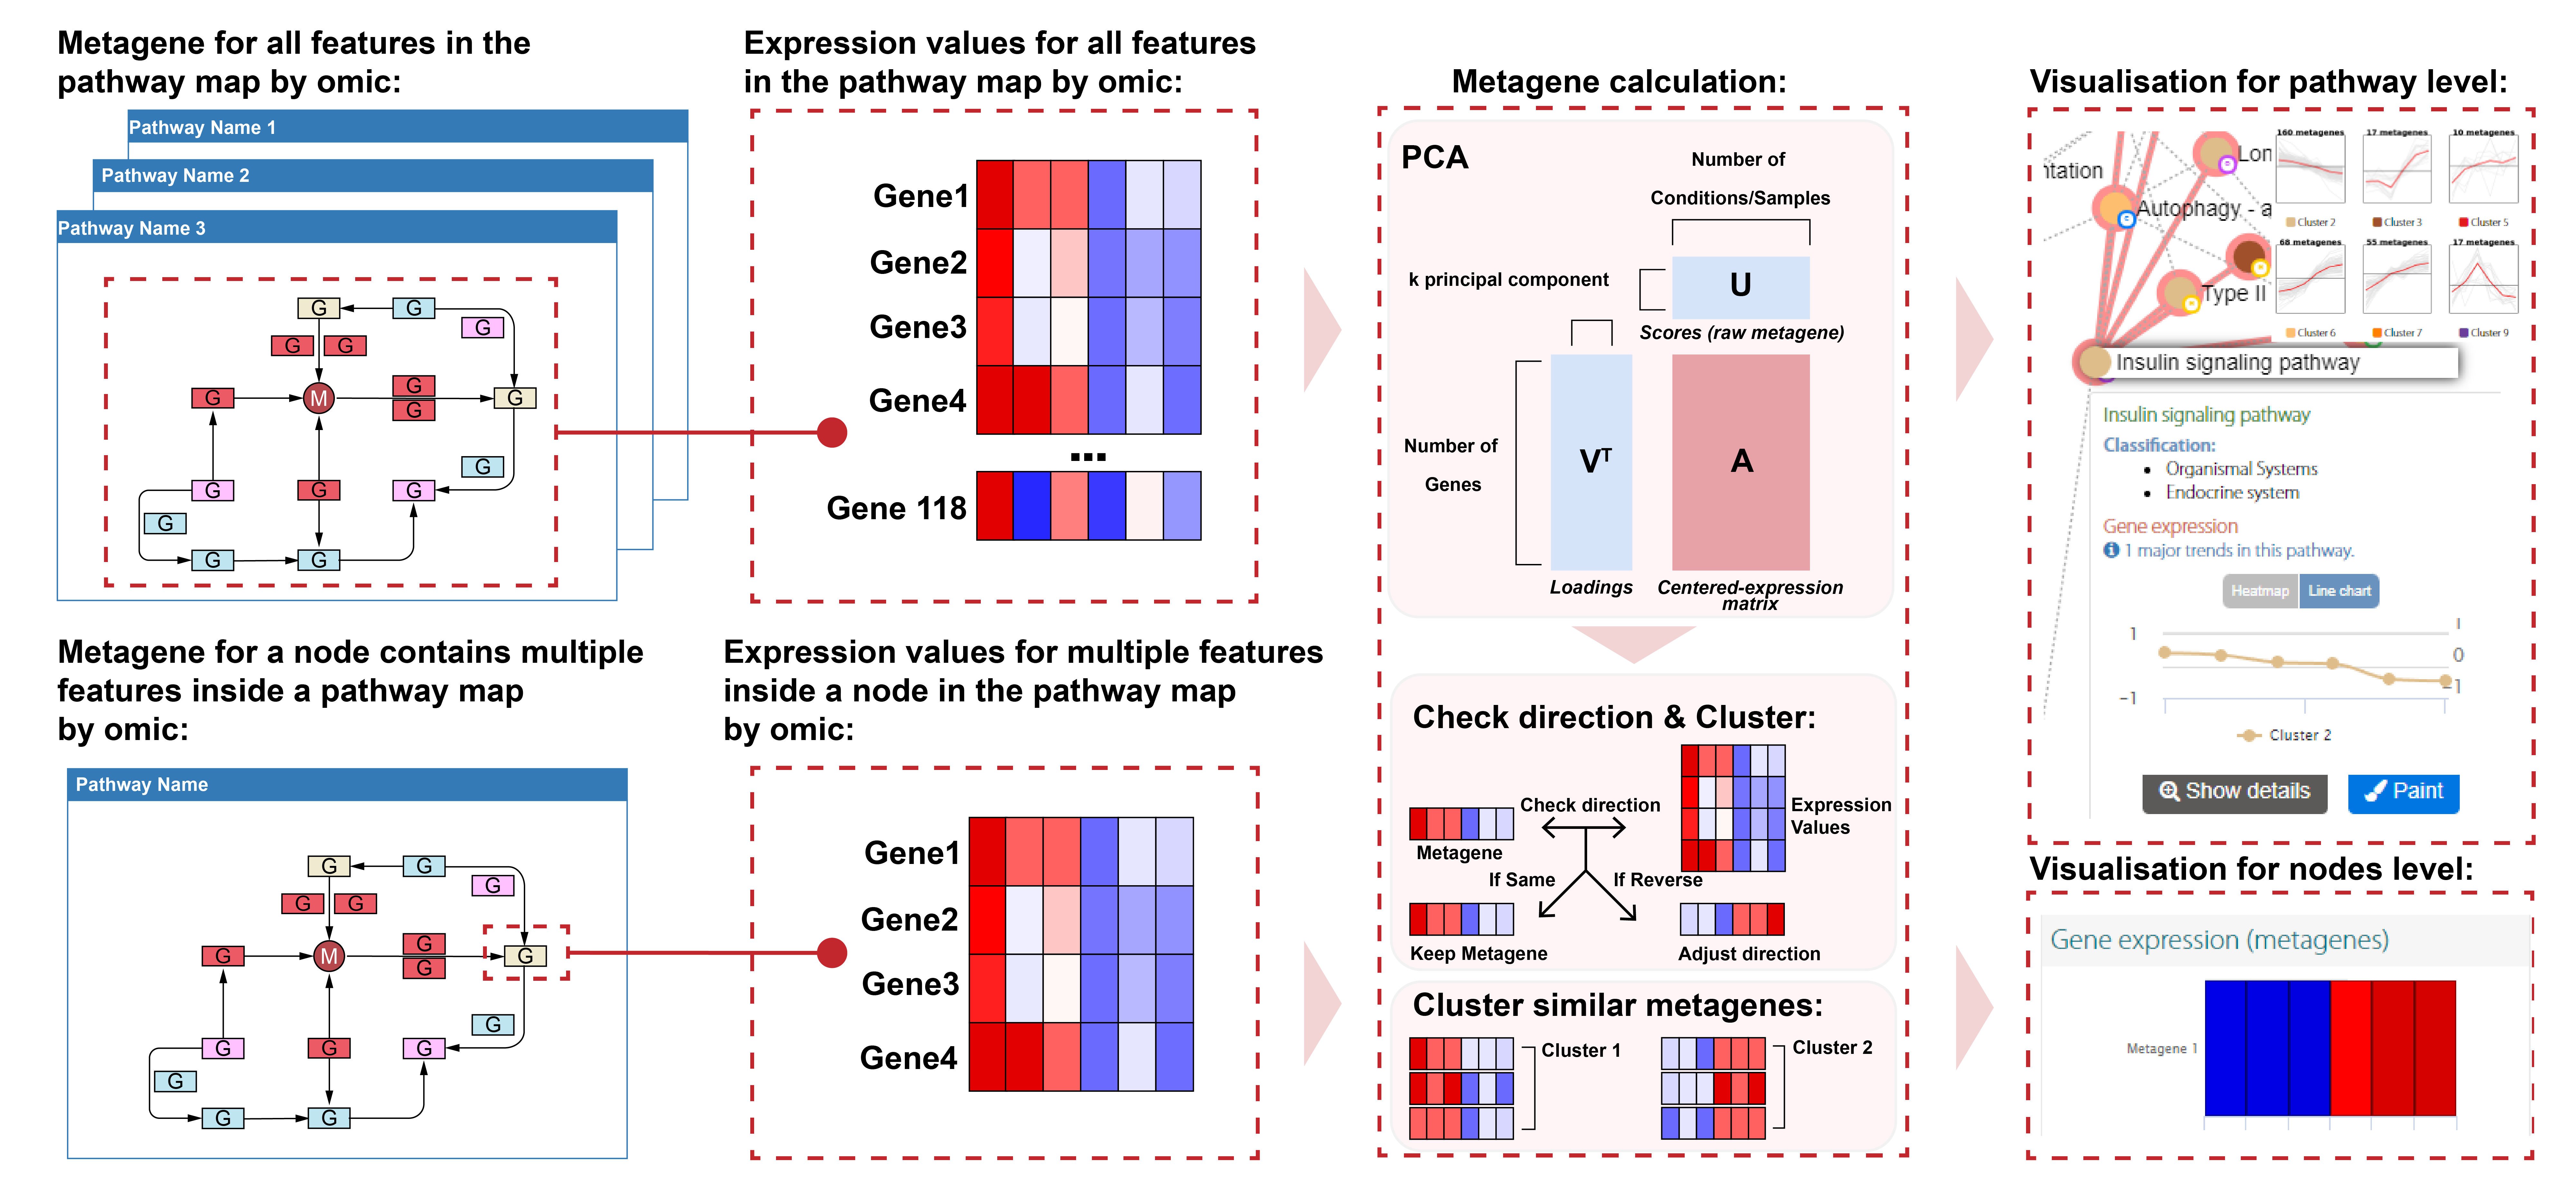
PaintOmics displays omics data on pathways maps by colouring the node position of the omic feature according to its experimental value. When a node contains multiple features, e.g. MapMan BINs, the map topology may not be able to accommodate the amount of data. In order to address this problem, metagenes are computed for pathway nodes with more than four matching features, resulting in a compressed representation of omics data in complex nodes that fits available space on the map. Note that when one node contains features with different profiles, the analysis might return multiple metagenes for the node, one per profile type (Figure 1).

Figure 1: Metagene represents an expression profiles of a group of genes; it is not an actual gene in the pathway.
Metagene calculation and visualisation
The data from different omics (gene expression, metabolomics, Proteomics...) are mapped to a pathway database or a node with multiple features inside a pathway to generate a set of submatrices containing the expression value of features. Then, submatrices are centred and analysed by Principal component analysis (PCA), which compresses the expression value of the pathway or pathway node information into a reduced number of profiles (metagenes). Those metagenes are the scores of the principal components (PC), and loadings indicate the contribution of each feature to the PC. Positive loading indicates a positive correlation between the expression value of the feature and the scores, while negative loading indicates a negative correlation. Then, the metagenes have adjusted the direction based on the loadings to follow the same trend as most features (Figure 1 Metagene calculation). PaintOmics 4 allow the user to view metagenes at pathway level in the pathway interaction network and view metagenes at node level directly in pathway-based visualisation (Figure 1 visualisation).