
Metabolite Hub Analysis
One of the goals of multi-omics studies that combine metabolomics and gene expression or proteomics data is to associate changes in metabolite levels with the regulation of the enzymes that may contribute to metabolite turnover. PaintOmics 4 leverages pathway information to identify metabolites that have a high proportion of differentially expressed features in their close network. The hub analysis evaluates genes directly connected in the network (step 1) or genes associated with the metabolite through up to 3 intermediate nodes (steps 2 to 4) (Figure 1).
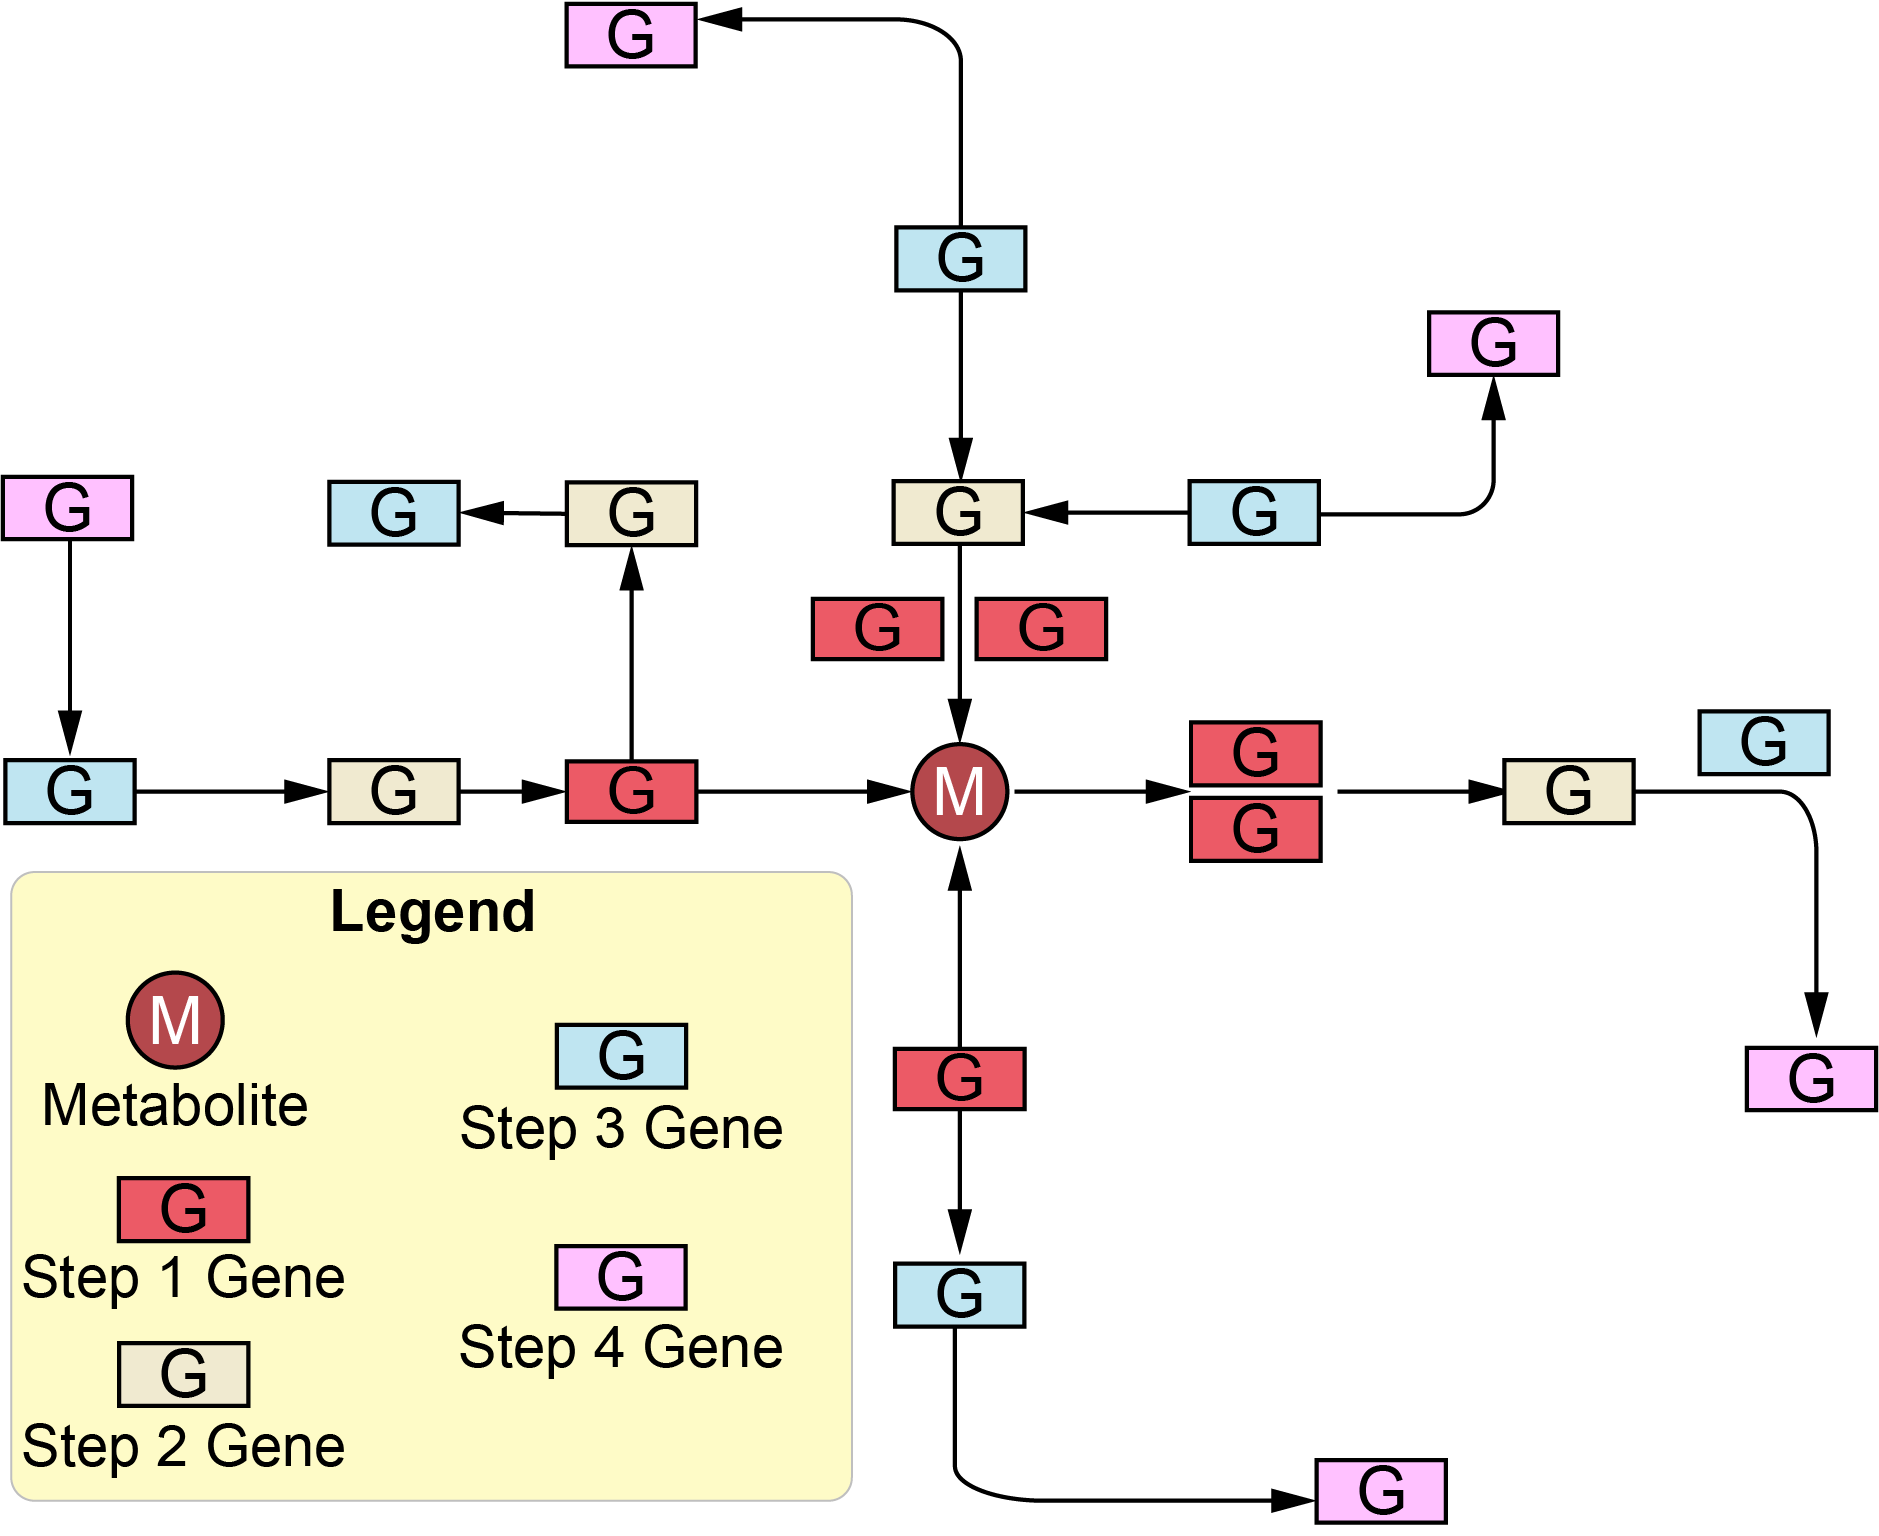
Figure 1: the meaning of "steps" in hub analysis network. The one-step means no other nodes between node 1 (analysis metabolite) and node 2 (means that node 1 is directly connected to node 2). The two steps allow one gap (node 2) between node 1 (analysis metabolite) and node 3. Therefore, with a higher step number, more nodes will be connected to the analysis metabolite.
Two tests were implemented. The binomial test is used to evaluate for each differentially expressed metabolite (DEM) the hypothesis that, given the overall percentage of differentially expressed genes (DEG) p0 in the dataset, the proportion of DEG linked to the metabolite is significantly higher than p0 (Figure 2B). P-values are corrected for multiple testing. Alternatively, the distribution in the overall metabolic network of the percentage of neighbouring DEG for metabolite nodes is computed and the percentile position of each measured metabolite in this distribution is calculated. Metabolites with a high percentile value have a higher proportion of connecting DEG than the majority of the metabolites in the database. In the database installation step, Paintomics 4 extracted the relationship between each metabolite and their neighbors across total pathways in the KEGG database for a given number of steps (typically 4) and generated a JSON file containing such information (Figure 2A).
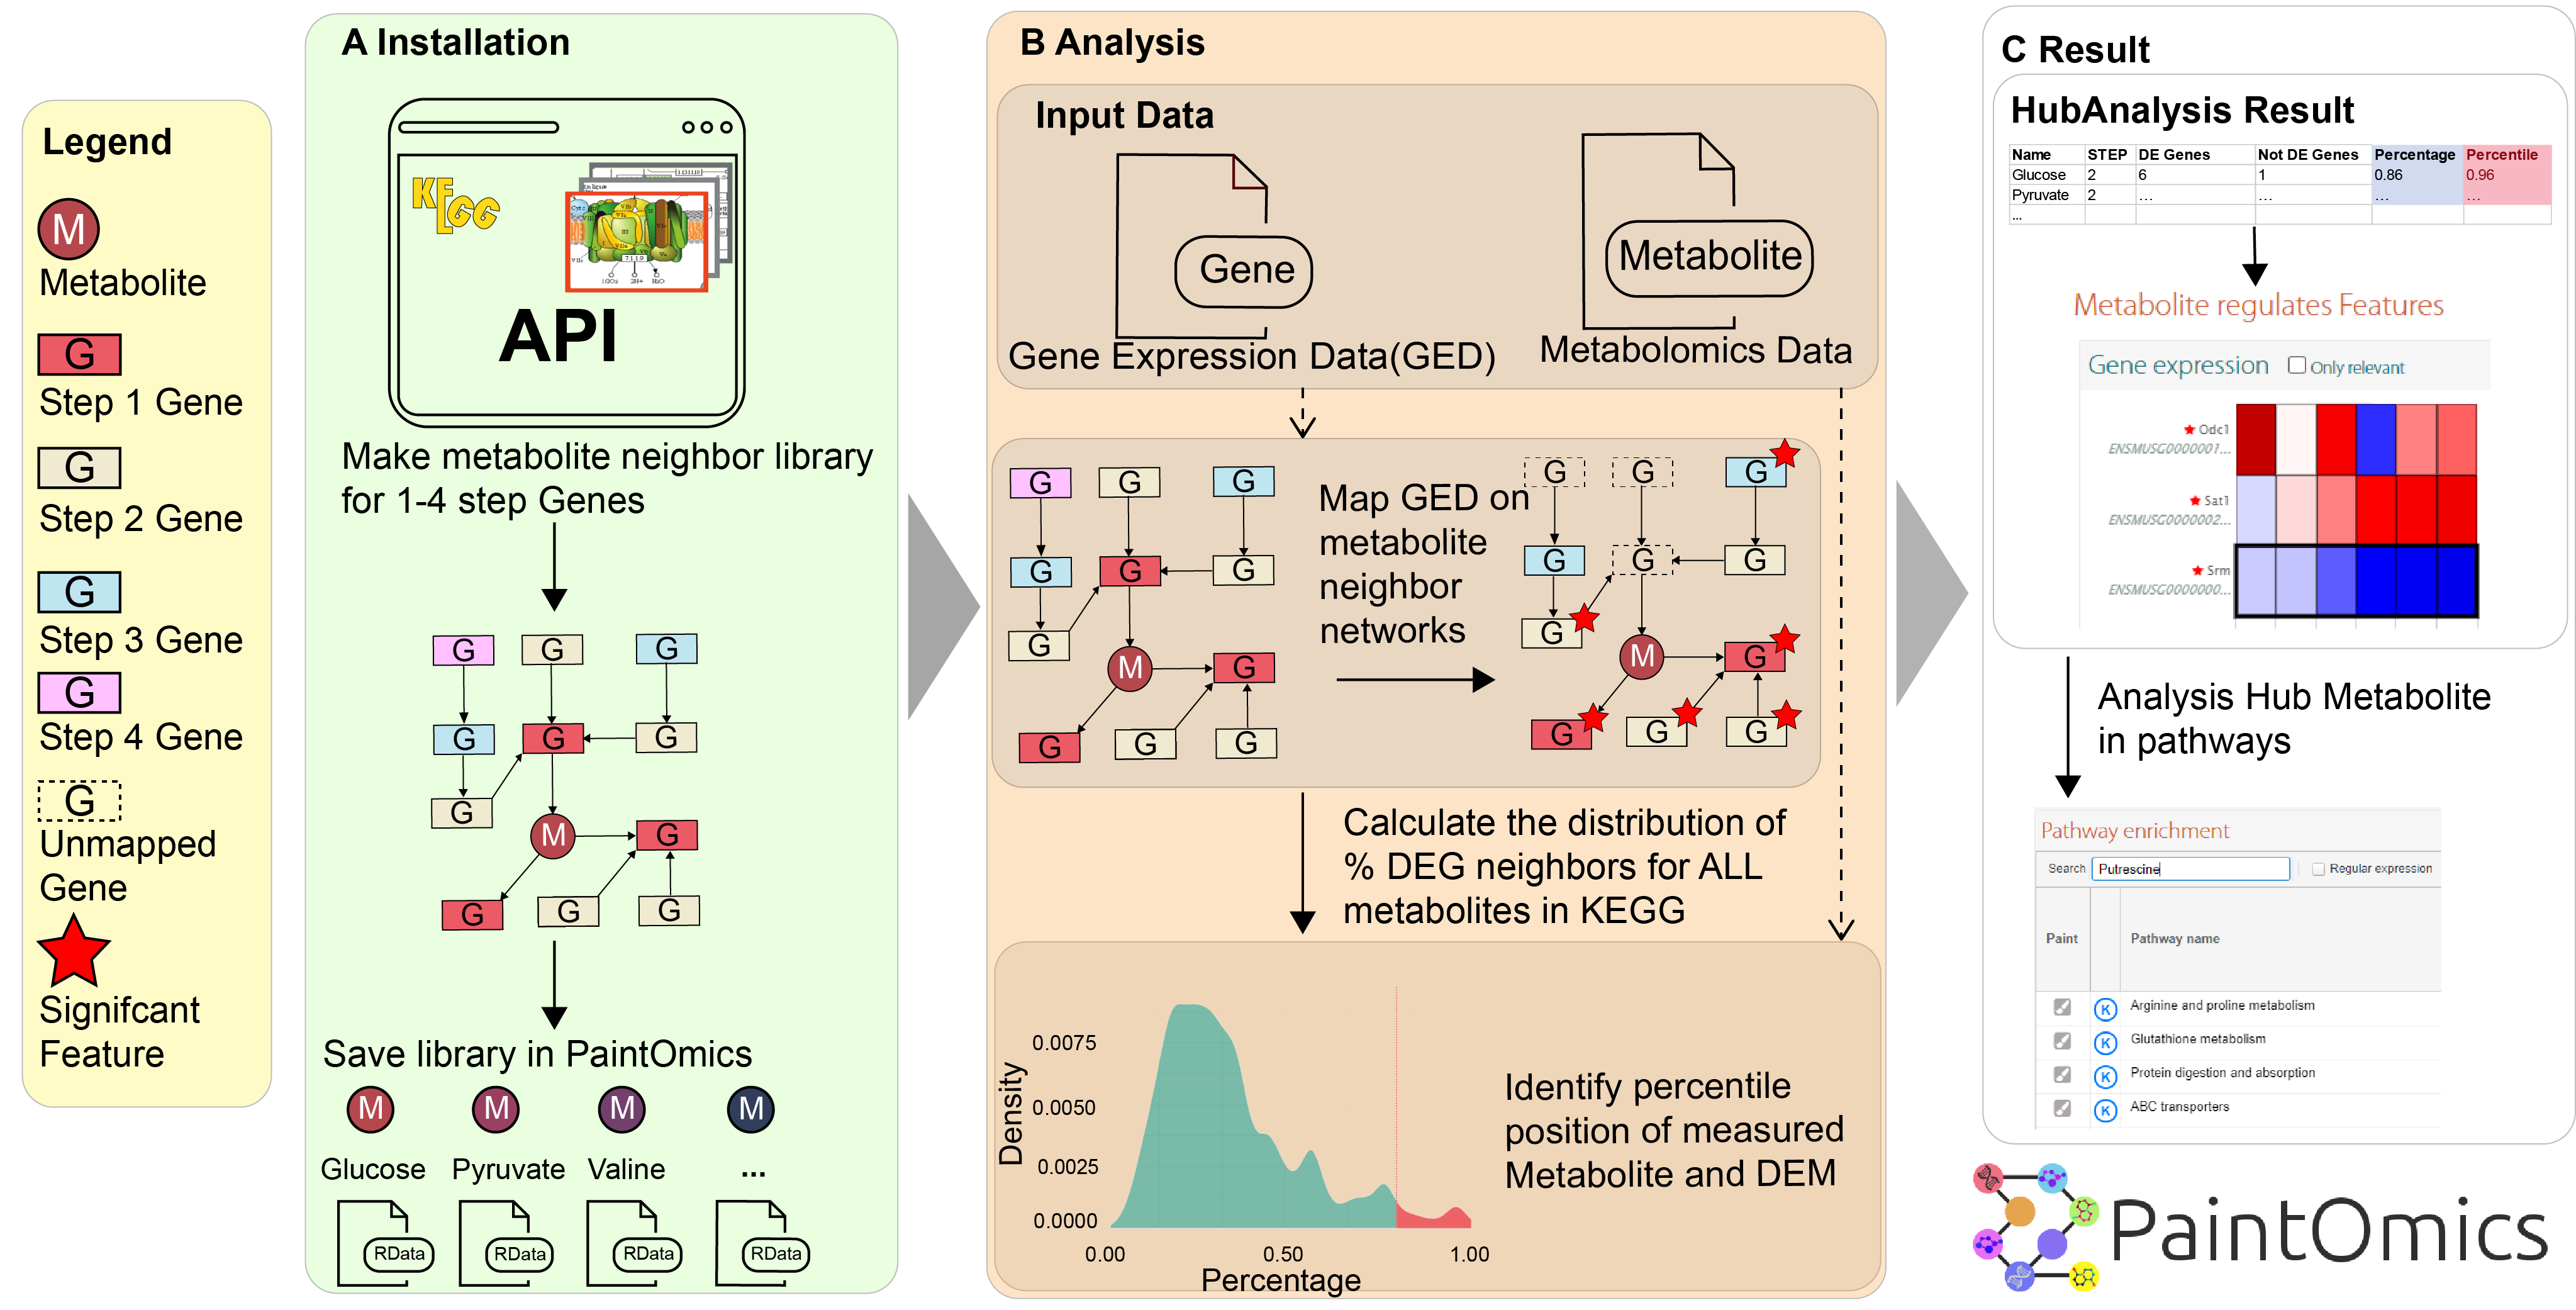
Figure 2: New metabolomics analysis in PaintOmics 4. (A) Neighbouring genes for each metabolite at 1 to 4 network steps are identified. (B) The percentile and binomial tests are used to identify metabolites with a high density of DEGs in their proximal network. (C) Metabolites and Genes identified in the analysis are shown as heatmaps with links to associated pathways. DEM: Differentially Expressed Metabolite; DEG: Differentially Expressed Gene.
PaintOmics 4 provides a separate table for metabolite hub analyses, including metabolite names that are hyperlinked to pathways. The metabolite hub analysis provides a graphical assessment of the magnitude of differential expression for linked genes and metabolites in a heatmap. These visualization tools enable easy navigation between metabolite data, neighboring genes, and metabolic pathways (Figure 2C and Figure 3).
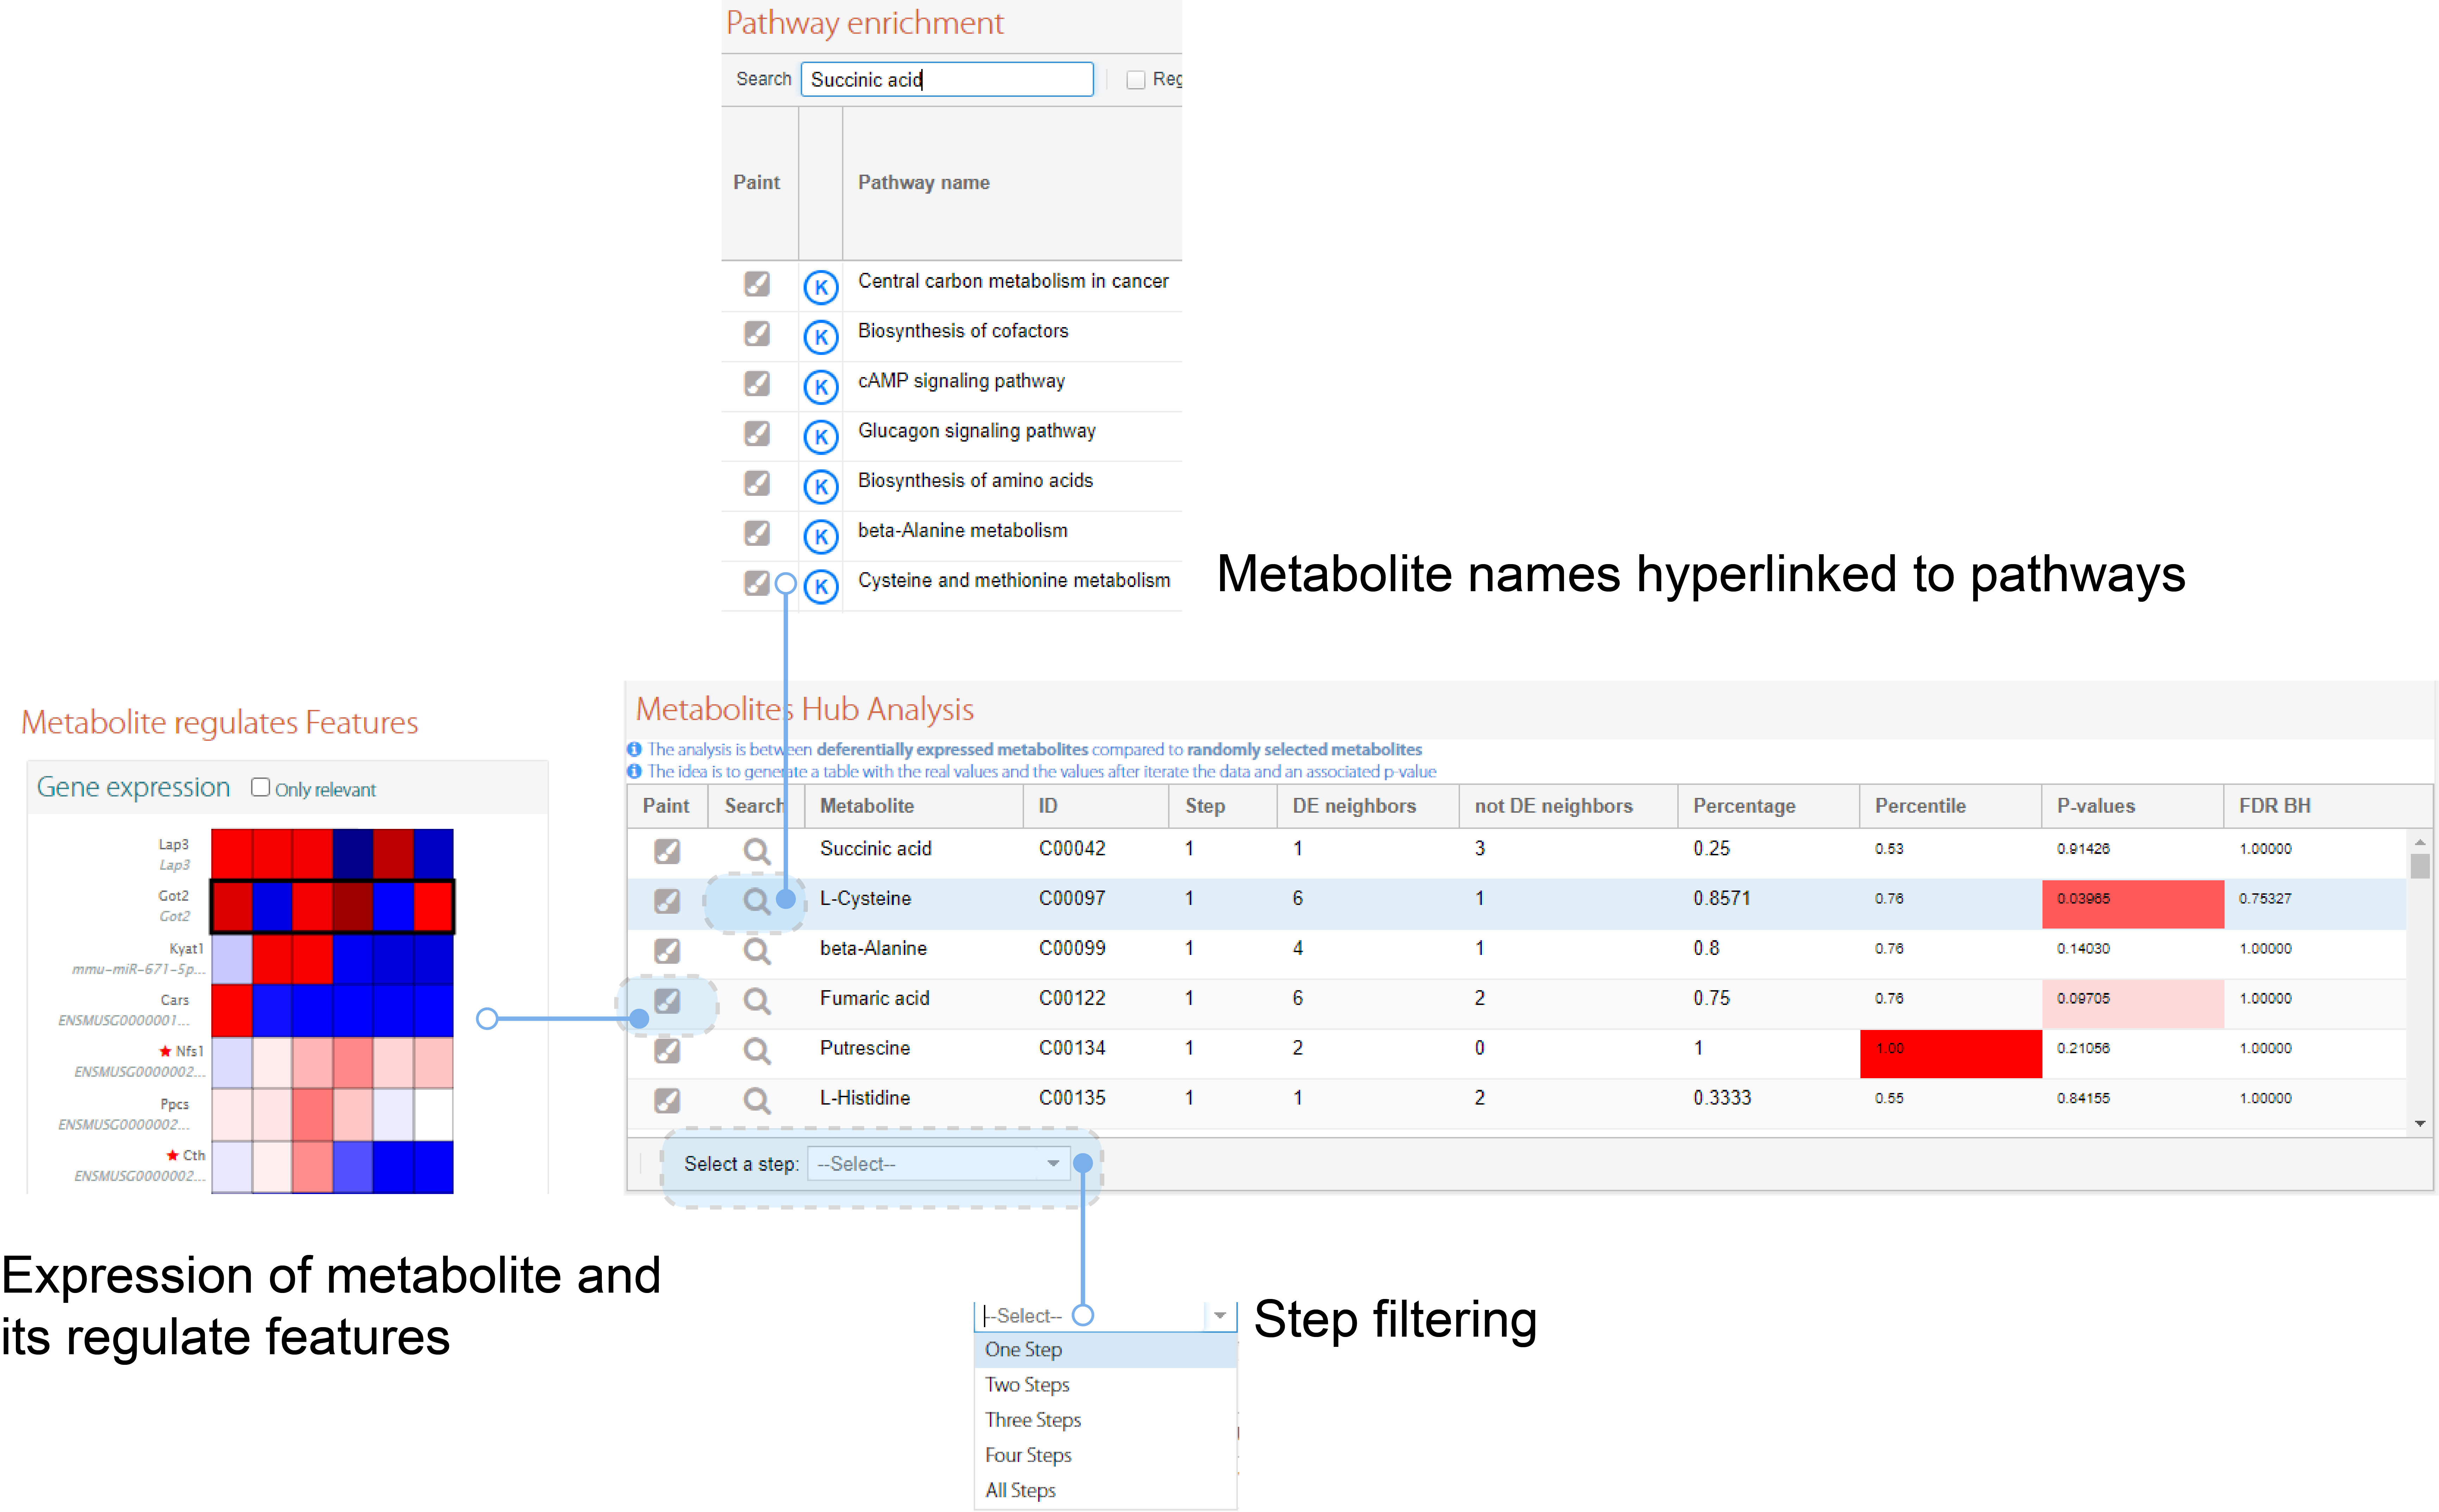
Figure 3: result visualization is designed for easy navigation between different PaintOmics analysis method (D)